"Even satellites can utilize the charts. Here’s a chart as seen by the satellite used for Google Maps"
It's not clear that that is a satellite photograph. Just because it was taken from above it doesn't mean a satellite did it. Mapping services (such as a Google's) do a disservice to call all this overhead photography 'satellite'. It's the sort of looseness that causes people to think cellular telephones also talk to satellites.
I just spoke to someone who thought that internet connections from the US to Europe go via satellite because there is so much water in between and you cannot just put a cable there. The cables are amazing (baffling even) but come on, they've been there for 150 years!
> Two American commercial satellite imagery firms — DigitalGlobe and GeoEye — have joined forces with the U.S. Geological Survey (USGS) in support of the global team of space and satellite agencies that constitute the International Charter "Space and Major Disasters".
> GeoEye satellite imaging technology is state-of-the-art. The geospatial data we capture provides clients with the highest resolution, most accurate satellite imagery in the world. ... We own and operate a constellation of Earth-imaging satellites and an international network of ground stations.
^ They even have pictures of the satellites (in case there is still any question that GeoEye is being misleading when they use the word "satellite" ;P).
Can you say more? I am more than happy to believe I'm analyzing the copyright wrong. Is the idea that that location is covered by a few different things, and the copyright is based on the location, not the data actually being shown? I had assumed that there was some complex relationship between the USGS and the localities involved in the photography.
Not really, I don't know a lot about it. My assumption is that Google shows attributions by lat/long and not zoom. I found one page about it, it doesn't say much:
I also assume that the USGS collects imagery from localities, but I think they are simply aggregating anything of sufficient quality that would be available under a FOIA request (or so, basically, cooperating with anyone that cooperates).
edit: USGS would be pulling in local data because it was more recent.
It's not that far off, there is a ton of satellite photography in Google Maps. It's the other way around, but satellites talk to cell phones and I don't fault people for not knowing it's one-way.
> It's the sort of looseness that causes people to think cellular telephones also talk to satellites.
Anyone who hasn't heard of a "cell tower" in 2013 just doesn't care about what makes the phone go. Cell phones have been around, talking to towers and not satellites, for decades. You can't help everyone.
Fascinating that there are air craft relics near the charts. I can only imagine that is part of the calibrating: so they can tell how large an aircraft is and what resolution they get for the size.
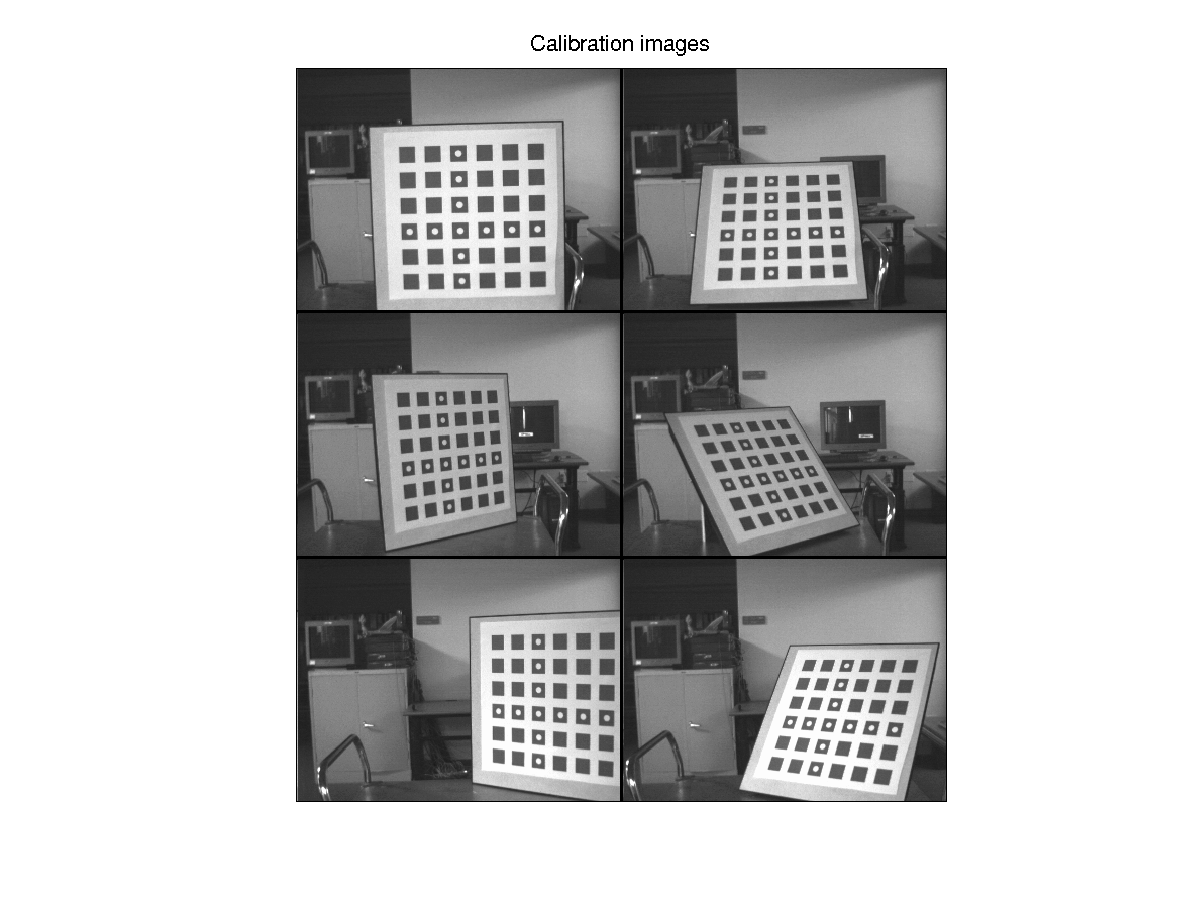
Is this test pattern in use in other known research?
Most of the test patterns I've encountered in using 'OpenCV' [1], 'laser scanning'[2], and 'structured light scanning' [3] have used equal sized geometric shapes. Not increasing in scale, so maybe that's useful.
MIL-STD-150A, dated 06 January 1998, is hereby cancelled without replacement.
With as many multi-spectral instruments we have floating about, I wonder what other shapes, compositions, or controlled temperature gradients might be in use under our noses.
The prerequisite being a 'Maps' site with <weekly aerial updates. While relatively plausible today (a few styrofoam drones, camera arrays, pay fer acre for 'crowdsourcing', ...)[1], the legal woes are frightening.
[1] 'relatively plausible' in relation to 'cubesats' and other aerospace driven monitoring.
How about just a large For Sale with an 800 number? If the property is under an approach to a busy airport. The audience being, of course, all those bored folks in window seats with electronics turned off below 10,000 feet.
Design your sign. Slice your image into two or three horizontal stripes. Then email your slices to one of those vinyl banner sign companies, to be printed on 8' x 50' strips.
One of the features of real-estate development is that a lot of research tends to be done anonymously to avoid tipping one's hand. In addition, many tracts of interest are not near airports, etc.
Because in experimental craft, one doesn't want to have to line up with a runway when the controls have stopped functioning or a wing has partly fallen off.
Once, when a test pilot landed the X-15 on a lakebed, the fuselage broke in two:
Quote: "The X-15-2 on Rosamond Dry Lake following mission 2-3-9*. The fuselage failed when the nose gear impacted the ground. The shock absorbing ability of the front landing gear strut was impaired by foaming of the oil in the strut when it was extended. The back of the X-15 broke at a structural join behind the cockpit."
What lutusp said plus the fact that the lakebed runways are much, much longer than the tarred runways. So the combination of much more width and much more length means its far safer to get an aircraft like the X-15 on the ground.
Yes. This is why runway numbers (which are the heading with the last digit removed) are known to change from time to time. Aviation charts also display the variation between magnetic and true north. (See the purple dashed lines with 14/15° W http://skyvector.com/?ll=40.55464932694554,-70.9421666906757... )
It's a pattern of circles that's printed on money, and when printers detect it in a file they will refuse to print that file. I wonder what would happen if we similarly embedded this pattern in landscapes. Would it prevent printing aereal photo's?
Sometimes these pictures are taken with 3 separate lenses and filters -- one for each color. Then they are merged. Sometimes that could get out of alignment.
It's not clear that that is a satellite photograph. Just because it was taken from above it doesn't mean a satellite did it. Mapping services (such as a Google's) do a disservice to call all this overhead photography 'satellite'. It's the sort of looseness that causes people to think cellular telephones also talk to satellites.